Introduction
Dental implant restoration is considered and accepted as a successful treatment modality both by patient and dentist in rehabilitating the edentulous situations ranging from single missing teeth to most complex edentulous situations. Endosseous implants lack periodontal ligament support and cushioning effect to compensate for stresses caused by inaccuracies in dental prosthesis. For this reason passive fit is the primary objective in fabricating a successful superstructure for osseointegrated implants.1 Even though obtaining absolute passive fit is practically impossible,2 it is still universally accepted that the prosthesis misfit should be minimized and an accurate impression is the first step in minimizing the misfit which precisely record the three-dimensional intraoral relationships among implants, teeth, and adjacent oral structures.3, 4
Studies have been done to evaluate the effects of several factors that can influence the accuracy of implant impressions, such as different impression materials and techniques, implant angulations, the impression coping’s modifications, type of impression tray and implant system tolerance etc. Questions have been raised whether there is one recommended impression material suitable for implant impressions over others; whether certain techniques are more reliable than others or certain implant angulations interfere with the reproduction of accurate 3 dimensional orientation of implant in the working cast.
Hence, there is a need for the present study to evaluate the linear dimensional accuracy of the impressions made with two different types of elastomeric impression materials using open tray technique in parallel and angulated implants by analyzing their positional relationship on the resultant casts. The impression materials used are poly vinyl siloxane and polyether.
Materials and Methods
This study was conducted in the Regional Dental College Guwahati, Assam, affiliated to the Shrimanta Shankardeva University of the Health Sciences Narakasur Hilltop, Guwahati-32; Assam, India with technical support from the Department of Mechanical Engineering, Indian Institute of Technology, Guwahati; Assam, India.
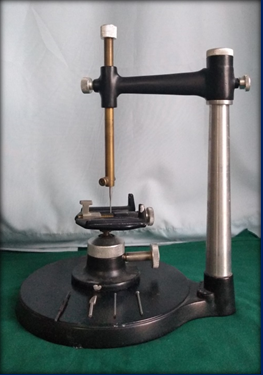
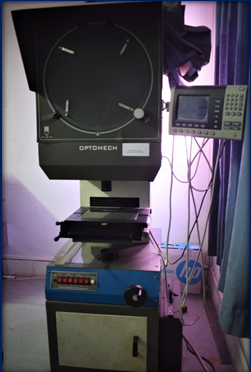
Surveyor with surveying tools (Figure 1) and Optomech vertical profile projector, Hyderabad , India (Magnification 5x, 10x,20x,50x,100) (Figure 2) were integral armamentarium used in this study.
Table 1
Descriptive statistics of theanteroposterior and mediolateral distance variations in terms of maximum and minimum values, mean and standard deviations with respect to the four different groups.
Table 2
Comparison of control values with observed individual mean distance values in respect to PVS impressions with parallel implants (group A)
Table 3
Comparison of control values with observed individual mean distance values in respect to PE impressions with parallel implants (Group B)
Table 4
Comparison of control values with observed individual mean distance values in respect to PVS impressions with angulated implants (Group C)
Table 5
Comparison of control values with observed individual mean distance values in respect to PE impressions with angulated implants (Group D)
Table 6
Comparison of observed individual mean distance values between group A and group C with respect to their control values.
Table 7
Comparison of observed individual mean distance values between group B and group D with respect to their control values.
Table 8
Comparison of observed individual mean distance values between group A and group B with respect to their control values.
Table 9
Comparison of observed individual mean distance values between group C and group D with respect to their control values.
Table 10
Overall descriptive statistics ofanteroposterior and mediolateraldistances in terms of maximum and minimum recorded values, group mean control values, observed mean values , standard deviation, variation of mean from the mean control values and p values irrespective of group.
Preparation of Master Model
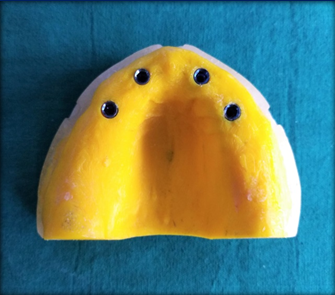
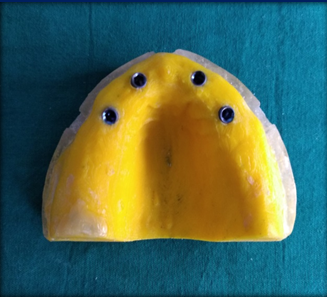
Two edentulous maxillary master models were fabricated with PLA (Polylactic acid) material from one virtual model using fused deposition modeling (FDM) technology which was exact replica of each other. Master models were labeled as Master model- 1 and Master model- 2(Figure 3, Figure 4). These master models are considered as control. Using the same FDM technology 4 implant sites were prepared in master model 1 and 2 during the time of its fabrication. In master model 1, implant sites were made parallel to each other and perpendicular to horizontal plane and in master model-2, two anterior implant sites were prepared at angulations of 150 convergence towards the midline where as the two posterior implant sites were ordered at angulations of 150 divergence with the longitudinal axis of the master models . The two anterior implant sites were at the top of the edentulous ridge with the mesial margin 5.2 mm from the midline. The other two posterior holes were prepared with their mesial margins at 7mm from the distal margin of the first ones. Four internal hex dental implants (Adin, dental implants, Israel, 3.75 X 10mm) were secured with cyanoacrylate into the model holes. Open tray transfer impression copings were screwed over the implants and master model-1 and master model-2 were prepared for impression making.
Preparation of trays
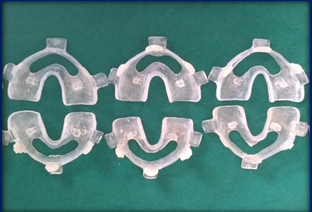
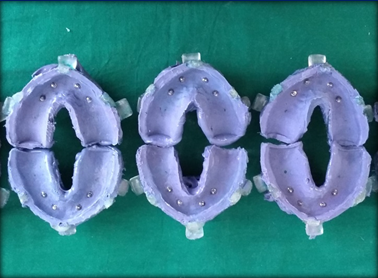
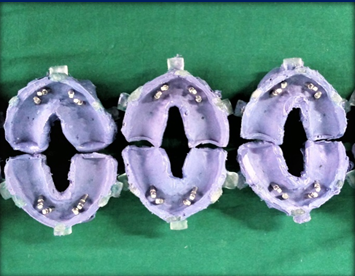
20 heat cure acrylic resin ((DPI Heat Cure, DPI, Mumbai, India) open custom trays were fabricated(Figure 5) having standard size and spatial orientation to fulfill the requirements of the study.
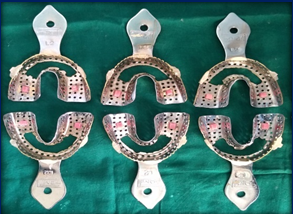
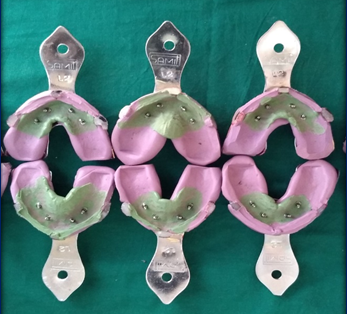
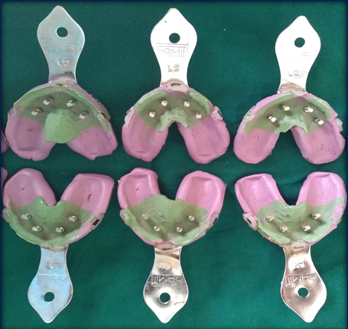
20 stainless steel mandibular perforated trays were selected and necessary modifications were done(Figure 6) for making impressions with single step putty light body impression technique
Impression making
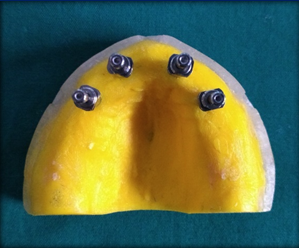
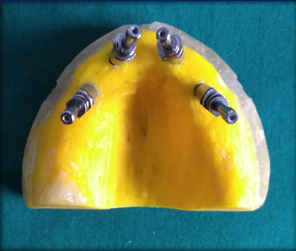
The open tray transfer impression copings were screwed into the implants on the master model 1 (Figure 7) and master model 2 (Figure 8) with a torque wrench. A total of 40 implant level impressions (Figure 9, Figure 10) were made, 20 with Polyvinyl siloxane (3M ESPE Soft Putty and light body Vinyl Poly siloxane, 3M ESPE, Seefeld, Germany) where 10 impressions for parallel implants and 10 for angulated implants and 20 with Polyether(Impregum; Medium body,3M ESPE, Seefeld, Germany) where 10 impressions for parallel implants and 10 for angulated implants using open tray technique.
Fabrication of experimental study model
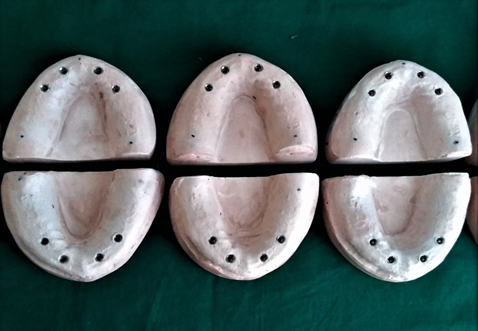
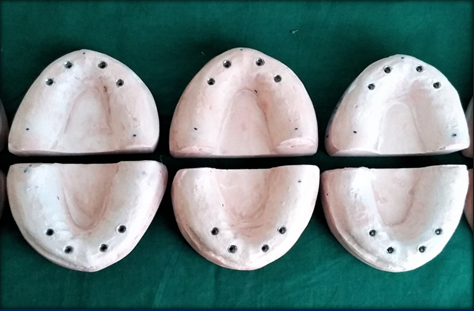
All 40 impressions with attached implant analogues (Figure 11, Figure 12) were poured using double pour technique with type IV gypsum product (Die stone, Kalrock, Kalabhai Karson Pvt Ltd, Mumbai, India). The specimen casts (Figure 13, Figure 14) were divided into four major groups based on two variables namely the impression material used(PVS and PE) and implant orientation (parallel and angulated) on the master casts and; which were as follows:-
Group A:- Casts obtained using PVS impression material from master model 1 (Parallel implants)
Group B:- Casts obtained using PE impression material from master model 1 (Parallel implants)
Group C:- Casts obtained using PVS impression material from master model 2 (Angulated implants)
Group D:- Casts obtained using PE impression material from master model 2 (Angulated implants)
Data collection
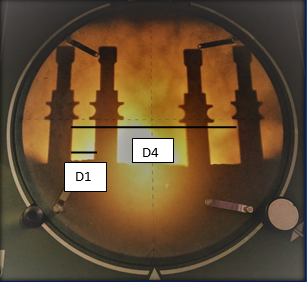
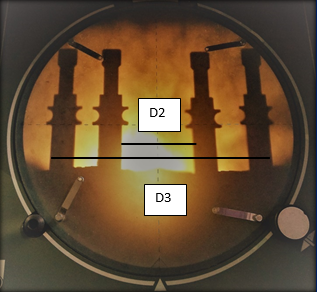
Data collection was done in the Department of Mechanical Engineering, IIT Guwahati, Assam; India. A single examiner blinded to the nature of the impression material and orientation of implants on the master model examined all the casts to evaluate the positional accuracy of the implant analogue using profile projector (Optomech, Vertical Profile Projector, Hyderabad, India). All the measurements were made at 10X magnification. The profile projector allowed measurement of linear distance with an accuracy of 0.002mm (2µm). All of the casts with attached fixed diameter transfer impression copings were secured to the centre of horizontal table of profile projector, and the 3-dimensional position was adjusted so that the vertical reference plane of the profile projector coincided with the mid plane of the models. In the device the light source projects a magnified image of the specimen onto the screen in the form of a shadow (magnification 10X) so that the distances were measured taking the references of the sharp edges of projected silhouetted from the analogs.
Four distances were measured on the control master models and on the study casts:
D1(anteroposterior)= the distance between the external sharp edge of projected silhouetted from the most anterior and most posterior right impression coping(Figure 15).
D2(mediolateral)= the distance between internal sharp edge of projected silhouetted from the most anterior left and right impression coping(Figure 16).
D3(mediolateral)= the distance between the external sharp edge of projected silhouetted from the most posterior left and right impression coping(Figure 16).
D4(mediolateral)= the distance between internal sharp edge of projected silhouetted from the most posterior left and right impression coping(Figure 15).
Data thus collected were tabulated and subjected to statistical analysis. All the statistics have been calculated and computed using IBM Statistical Package for Social Sciences (SPSS) version 20.
Result
To subject the data for statistical analysis, the differences of the D1, D2, D3, and D4 distances between the observed value on the study casts and the control values measured on the master models are calculated and recorded. The variations of the mean values with respective control values within a group are tested for statistical significance with one samples t-test at 0.05 significance level. The differences in the mean anteroposterior (D1) distance and individual mean mediolateral(D2/D3/D4) distance variations between the groups are subjected to statistical analysis at 0.05 significance level using independent samples t-test. The results of the statistical analysis are as follows
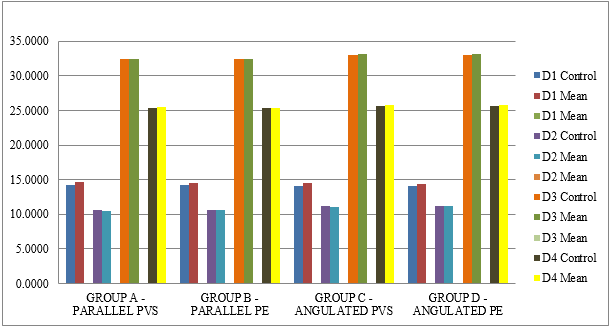
Table 1: depicts the descriptive statistics of D1, D2, D3, D4 values with respect to four different groups based on implant orientation (parallel or angulated) and impression material used (PVS or PE).
Table 2 : Shows the descriptive statistics of theanteroposterior and mediolateral distance variations in terms of control values, mean value, standard deviation, variation of mean from the control and p values in respect to PVS impression with parallel placed implants (group A), PE impressions with parallel implants (Group B), PVS impressions with angulated implants (Group C) and PE impressions with angulated implants (Group D).
The comparison of the observed mean values with their respective control values is analyzed using one sample‘t’ test at 0.05 significance level.
The difference between the mean D1 value and the control D1 value is 0.3111 mm which is found to be statistically significant (p = 0.031). Likewise, the differences of mean D2, D3 and D4 value from the respective control value are – 0.0292 mm, 0.0803 mm and 0.1108 mm with their p values 0.043, 0.005. and p < 0.001 respectively which indicates significant difference in D2, D3 and highly significant difference in D4.
Amongst the D1, D2, D3, and D4 values in Group A, the highest variation of mean from control is observed in D1 value with a mean variation of 0.3111 mm.
Table 3: Shows the descriptive statistics of theanteroposterior and mediolateral distance variations in term of control values, observed mean values, mean variation from the control values, standard deviation and p values with respect to Group A and Group C as well as between group B and Group D. It depicts comparative influence of implant orientation (parallel or angulated) on dimensional accuracy of impressions made with PVS and PE respectively using open tray technique.
The difference in the variation values were tested for statistical significance using independent sample t-test. In case of comparison between Group A and Group C D1, D2 and D4 , the p values obtained are 0.533, 0.209 and0.052 which are found to be non significant. In case of D3, the p value is 0.002 and which is found to be statistically significant.
The variations of mean values from control values are observed to be higher in Group C in comparison to Group A when considering D1, D2, D3 D4 distances.
Where as In case of in case of comparison between Group B and Group D; D1 and D2 the p values obtained are 0.996 and 0.613 which are found to be non significant. In case of D3 and D4 the p values are0.003 and 0.018 which are found to be statistically significant.
The variations of mean values from control values are observed to be higher in Group D in comparison to Group B when considering D1, D2, D3 D4 distances.
Table 4: shows the descriptive statistics of theanteroposterior and mediolateral distance variations in term of control values, observed mean values, mean variation from the control values, standard deviation and p values with respect to Group A and Group B as well as between Group C and Group D. It depicts comparative influence of impression materials (PVS and PE) on positional accuracy of parallel placed implants and angulated implants respectively
The difference in the variation values are tested for statistical significance using independent sample t-test. In case of Group A and Group B; D1 and D2 the p values obtained are 0.490 and 0.407 which are found to be non significant. In case of D3 and D4 the p values are 0.04 and <0.001 which are found to be statistically significant.
The variations of mean values from control values are observed to be higher in Group A in comparison to Group B when considering D1, D2, D3 D4 distances.
Where as in between Group C and Group D; D1, D2 and D3 the p values obtained are 0.071, 0.219 and 0.075 which are found to be non significant. In case of D4 the p value is <0.001 which is found to be statistically highly significant.
The variations of mean values from control values are observed to be higher in Group C in comparison to Group D when considering D1, D2, D3 D4 distances.
Table 5: depicts the descriptive statistics of D1, D2, D3 and D4 distances in terms of maximum and minimum recorded values, group means, control values, observed mean values, standard deviation, variation of mean from the mean control values and p values irrespective of group.
The differences in the variation values are tested for statistical significance using independent sample t-test. In case of D2 the p values obtained is 0.423 which is found to be non significant. In case of D3 the p value is 0.031 which is found to be statistically significant and in case of both D1 and D4 the p value is <0.001 which is found to be statistically highly significant.
Table 6: shows the descriptive statistics of the anteroposterior and mediolateral distance variations in term of control values, observedmean values, mean variation from the control values, standard deviation and p values with respect to Group A and Group C. It depicts comparative influence of implant orientation (parallel or angulated) on dimensional accuracy of impressions made with PVS using open tray technique.
The difference in the variation values were tested for statistical significance using independent sample t-test. In case of D1 ,D2 and D4 , the p values obtained are 0.533, 0.209 and0.052 which are found to be non significant.In case of D3, the p value is 0.002 and which is found to be statistically significant.
The variations of mean values from control values are observed to be higherin Group C in comparison to Group A when considering D1, D2, D3 D4 distances.
Table 7 : shows the descriptive statistics of the anteroposterior and mediolateral distance variations in term of control values, observedmean values, mean variation from the control values, standard deviation and p values with respect to group B and group D. It depicts comparative influence of implant orientation (parallel or angulated) on dimensional accuracy of impressions made with PE using open tray technique.
The difference in the variation values are tested for statistical significance using independent sample t-test. In case of D1 and D2 the p values obtained are 0.996 and 0.613 which are found to be non significant. In case of D3 and D4 the pvalues are0.003 and 0.018 which are found to be statistically significant.
The variationsof mean values from control values are observed to be higher in GroupD in comparison to GroupB when considering D1, D2, D3 D4 distances.
Table 8: shows the descriptive statistics of theanteroposterior and mediolateral distance variations in term of control values, observed mean values, mean variation from the control values, standard deviation and p values with respect togroup A and group B. It depicts comparative influence of impression materials( PVS and PE) on positional accuracy of parallel placed implants.
The difference in the variation values are tested for statistical significance using independent sample t-test. In case of D1 and D2 the p values obtained are 0.490 and 0.407 which are found to be non significant. In case of D3 and D4 the p values are 0.04 and <0.001 which are found to be statistically significant.
The variations of mean values from control values are observed to be higher in Group A in comparison to Group B when considering D1, D2, D3 D4 distances.
Table 9: shows the descriptive statistics of the anteroposterior and mediolateral distance variations in term of control values, observed mean values, mean variation from the control values, standard deviation and p values with respect to group C and group D. It depicts comparative influence of impression materials(PVS and PE) on positional accuracy of angulated implants.
The difference in the variation values are tested for statistical significance using independent sample t-test.. In case of D1, D2 and D3 the p values obtained are 0.071, 0.219 and 0.075 which are found to be non significant. In case of D4 the p value is <0.001 which is found to be statistically highly significant.
The variations of mean values from control values are observed to be higher in GroupC in comparison to GroupD when considering D1, D2, D3 D4 distances.
Table 10 depicts the descriptive statistics of D1, D2, D3 and D4 distances in terms of maximum and minimum recorded values, group means, control values, observed meanvalues, standard deviation, variation of mean from the mean control values and p values irrespective of group.
The differences in the variation values are tested for statistical significance using independent sample t-test. In case of D2 the p values obtained is 0.423 which is found to be non significant. . In case of D3 the p value is 0.031 which is found to be statistically significant and in case of both D1 and D4 the p value is <0.001 which is found to be statistically highly significant.
The highest overall variation of mean from control is observed in case of recording D1 distance.
Discussion
In implant Prosthodontics, making a cast reproducing the intraoral position of implants and abutments as accurately as possible is paramount, in order to limit discrepancies in fit, including those not clinically detectable by visual inspection.5, 6, 7 The first step in achieving an accurate, passively fitting prosthesis is to reproduce the exact three-dimensional positions and intraoral relationships of the implants in the impression. Accordingly, the present study was conducted to evaluate the effect of linear dimensional accuracy of impressions made with two different impression materials namely PVS and PE in reproducing the relative positions of angulated and parallel placed implants on resultant dental casts.
The distortion of the impression is an inherent concern in all of the procedures involved in the indirect dental restorations.8, 9, 10 It can be regarded as absolute or relative, depending on the point of reference from which it is measured. The absolute distortion is considered when the point of reference is external, whereas a relative distortion is measured from a point that is located internal to the system.11, 12, 13 In the present investigation, the relative distortion was considered as a study parameter, as the resultant transitional distance was measured from one coping to another. This kind of measurement can be considered more clinically relevant than the absolute distortion, as an implant supported prosthesis usually connects all the abutments to each other.
The present in vitro study uses PLA control model having elastic properties comparable to bone, with some anatomical undercuts to simulate more realistic clinical conditions unlike the smooth, undercut free rigid acrylic models used in some previous studies.
Impression materials chosen in this study were medium consistency single mix polyether and putty light body combinations of PVS for single step method. Polyether was used in this investigation due to its resistance to permanent deformation, low strain in compression, favorable shore A hardness, and high initial tear strength14 while PVS was chosen for its acceptable outcome for complete-arch multi-implant impressions.3, 15 Although polyether has been the material of choice in many studies, using single step putty and light body polyvinyl siloxane impression material, especially when employed with the stock tray, has gained popularity in recent years.16, 17 Wenz et al. 15 reported that the regarding PVS single step method was more accurate than the two step method or single viscosity technique using medium body vinyl polysiloxane.
In the present study, in case of PVS impressions with parallel placed implants, the mean linear intercoping distances (Table 2) showed significant statistical difference from its control values. Where as in case of polyether impressions with parallel implants (Table 3) the differences in mean mediolateral intercoping distances (D2 and D4) from its control values were not found to be statistically significant. These findings of the present study support the results of the study conducted by Sorrentino et al.18
When impressions were made with PVS in angulated implants (Table 4) the mean error of intercoping distances from its control values were found statistically highly significant except the mediolateral distance between the two anterior implants (D2). In case of PE impression with angulated implants (Table 5) the mean error of intercoping distance from its control value was also not found statistically significant in case of the mediolateral distance between the two anterior implants (D2). However, in this group the variation of mean distances from its control is found to be less in comparison to PVS impressions with angulated implants. This result is in accordance with a study conducted by Akalin et al.19
This study also analyze effect of implant orientation on dimentional accuracy of impressions made with PVS and PE impression material. Studies had reported that in cases with multiple implants, one of the most important criteria affecting implant impression accuracy was the magnitude of implant angulations with respect to the horizontal crestal plane. 19 Few other studies had reported less accurate impressions with angulated implants than with straight implants using an experimental cast with 4 or 5 implants.20, 21 The findings of the present study indicated that both the impression materials (PVS and PE) had shown some degree of error. The variations in distances were found to be higher in angulated implant models as compared to models with parallel implants. In the present study, in case of PVS impression material the (individual) mean error from control in recording the angulated implant position (Table 6) was higher in comparison to the parallel placed implants. This error was found to be ststistically significant in case of recording mediolateral intercoping distance between external surface of two posterior implants (D3) in comparison to the recorded inter coping distance in parallel placed implants. Regarding PE impression material, the (individual) mean error from control in recording the angulated implant position (Table 7) was higher in comparison to the parallel placed implants. This error was found to be statistically significant in case of recording mediolateral intercoping distance between external surface of two posterior implants (D3) and between internal surface of two posterior implants( D4), in comparison to the recorded intercoping distance in parallel placed implants. Moreover, considering total mean error of anteroposterior and mediolateral distances while recording the angulated implant position, these mean errors were found to be higher than the mean errors recorded in case of parallel implants with PVS and PE impression materials respectively. Same kind of result was found in study conducted by Zerrin Fidan Akalin.22 In case of angulated implants, rotational misfit may lead to more horizontal discrepancy in comparison to the parallel placed implants. As implant angulations increase, amount of forces of deformation increases which require an impression material which can withstand these forces that affect the accuracy of master cast,22 Especially in multiple implant cases, an increase in implant angulation increases the area of friction and the amount of stresses generated in an impression decreasing impression accuracy.20, 23
The changes in mean intercoping distances in anteroposterior and mediolaterial direction that occurred in the resultant models were analyzed in comparision to their respective master models(Table 10). This comparison helped to analyze in which direction variation was more when lion share of the applied force for removal of the impression was anteroposterior in direction. It was observed that irrespective of impression material used, the recorded anteroposterior distance(D1) had highest mean error and it was found to be statistically highly significant(P<0.001) . The reason for more distortion in anteroposterior direction may be due to the path of removal (anterior to posterior) of the impression tray from the model which exerts more stress on the impression materials from anterior to posterior direction compared to buccal and lingual directions. This study result is similar to the study done by Behnaz Ebadian. 24 The distance change in the anteroposterior direction was more in PVS as comparison to polyether, which may be due to greater elastic modulous and torque resistance of polytether.
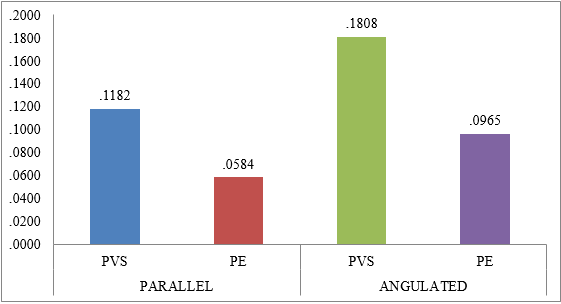
Comparing the two materials used in this study, PVS showed more error than PE in transfer of linear interimplant distance in case of parallel placed implants(Table 8). This error was statistically significant in case of recording mediolateral interimplant distance between external surface of two posterior implants (D3) and between internal surface of two posterior implants(D4). Again if we compare the precision of recorded interimplant distance with PVS and PE impression material in angulated implants (table-9), we can observe that in case of PE impressions error was less. This difference in the error was statistically highly significant in case of recording intercoping distance between internal surface of two posterior implants(D4). While comparing the total mean error in anteroposterior and mediolaterial distances, it was found that polyether impression material was more accurate in reproducing implant positions (Dig-1) in comparison to impressions made with PVS impression material both in case of angulated and parallel placed implants. More precision obtained from polyether impressions3 may be contributed to its high rigidity which helps holding the impression copings in their position while removing the impression and therefore, minimal positional displacement of impression copings occurs. These findings are consistent with study by Del’Acqua et al.25 and Kankane’s26 study which examined polyether and polyvinyl siloxane impression precision of a master model of an edentulous mandible containing four implants. In a study by Vojdani et al.27 no significant difference was seen between polyether and polyvinyl siloxane in parallel implants while polyvinyl siloxane showed better results than polyether in angulated implants. Some other studies28, 29 reported polyvinyl siloxane to be more precise than polyether with direct technique. Studies by Reddy, Karl showed little or no difference between polyether and polyvinyl siloxane when using a direct technique,. 30, 31 Considering rotational transfer precision of implants in the present study, it was conceived that with direct (open tray) impression technique, polyether result in less discrepancy compared to polyvinyl siloxane. We32 reported that for completely edentulous multiple-implant restorations, the use of polyether showed the best results . A study by Akalın et al.19 also showed better results with polyether than polyvinyl siloxane with a direct impression technique. In contrast, Lee et al.6 and Sorrentino et al.18 reported less discrepancy with polyvinyl siloxane in comparison to PE impression material in recording positional accuracy of angulated implants. Using polyether impression material with the “snap on” method, Lorenzoni et al.33 observed interimplant deformation (mean error) values between 18 and 800 μm. Akça and Çehreli34 performed the “snap on” method with polyether and found interimplant deformation values of 92 to 559 μm in the x axis. The interimplant relationship deformation values observed in the present study were found consistent with the results of both these studies.
It is observed that literature is inconsistent regarding impression materials precision. This is mostly due to different methodology of the studies. Definition of precision, devices used to measure the discrepancies between the original model and the duplicates, parameters that were evaluated and sample sizes of the studies were not all the same in different studies. Number of the implants, system of implants and manufacturers of materials were among a wide range. Even within a specific type of material, different viscosities of the same impression material show different mechanical properties; hence their ability to withstand stresses before a permanent deformation occurs would be different.35 One important point that needs attention when interpreting studies is machining tolerance among different implant components. 36 Machining tolerance is the probable mismatch of paired machined components and is reported to range from 22 to 100 μm.37 Even though the machining tolerance was not measured separately in these studies, it is believed that a significant amount of the discrepancy might have originated from the machining tolerance. When the results of the studies investigating the implant impression accuracy are interpreted, the machining tolerance should be considered as one of factors affecting accuracy.
Possible limitations of the present study design were that the measured distortions did not completely evaluate the actual three-dimensional distortion of the impressions and the axial rotations of the components were not detected. Moreover, the results of the present investigation were limited to a number of four implants and may not be relevant for impressions made in the presence of higher or lower numbers of implants. Hence, to make the results of the present study clinically implacable further clinical studies are invited considering recent advances in implant impression techniques which will help in recording 3- dimensional intraoral implant abutment
relations in order to fabricate a passively fitting prosthesis.
Conclusion
Within the limitation of the present study, following conclusions were drawn:-
Some extent of discrepancy is inevitable with both polyether and polyvinyl siloxane impression material tested in this study.
The discrepancy of linear distance between the implants was most in the anteroposterior direction
The more parallel the implants, the more accurate the impression.
The greatest amount of deformation occurred in angular model measurements.
The use of polyether impression material resulted in more accurate casts both in the presence of parallel or angulated implants.

